By Julia Malmo
Ever wonder about the effectiveness of projects after they go into the ground? Us, too!
That’s why, in 2017, we launched the Safe Streets Evaluation Program to help project teams understand whether a transportation safety project’s design is effective, and where there might be opportunities to adjust the design if not. Project evaluation data can also be combined across projects to help the SFMTA track the effectiveness of a certain type of safety improvement, which can in turn streamline the design of future projects. The Safe Streets Evaluation Program helps us work towards achieving Vision Zero, an initiative to prioritize street safety and eliminate traffic deaths in San Francisco.
This week, we’re looking back on five years of data gathered through our Safe Streets Evaluation Program with the “2022 Safe Streets Evaluation Summary,” an interactive website summarizing the results of 18 bicycle, pedestrian and traffic safety projects implemented since 2017.
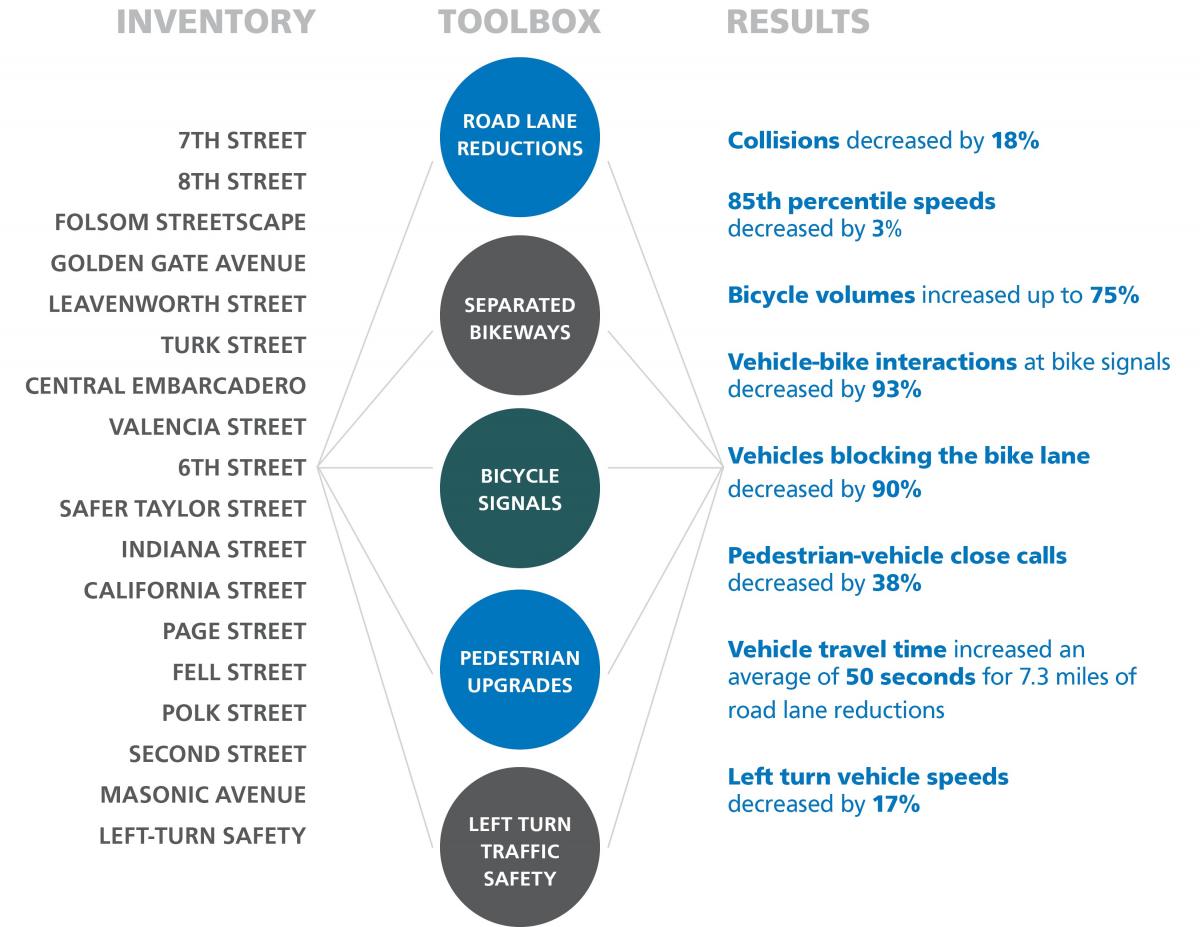
Each of the 18 projects evaluated in the summary report added significant safety upgrades to the streets. Some introduced vehicle travel lane removals (road diets), separated bikeways, separated bike signals, or left-turn traffic calming devices. Others brought general improvements for pedestrians at intersections including pedestrian signal improvements, daylighting (red zones at intersections) and upgraded crosswalks. For every project, the SFMTA drew on a wide range of data—from project-specific observations, to police reports, to speed data—to create a comprehensive view into its’ effectiveness.

The evaluation report indicates that the SFMTA’s safety tools are working together to create safer environments for all modes of transportation on city streets.
You can dig into the whole set of outcomes on the website, but here are some highlights:
-
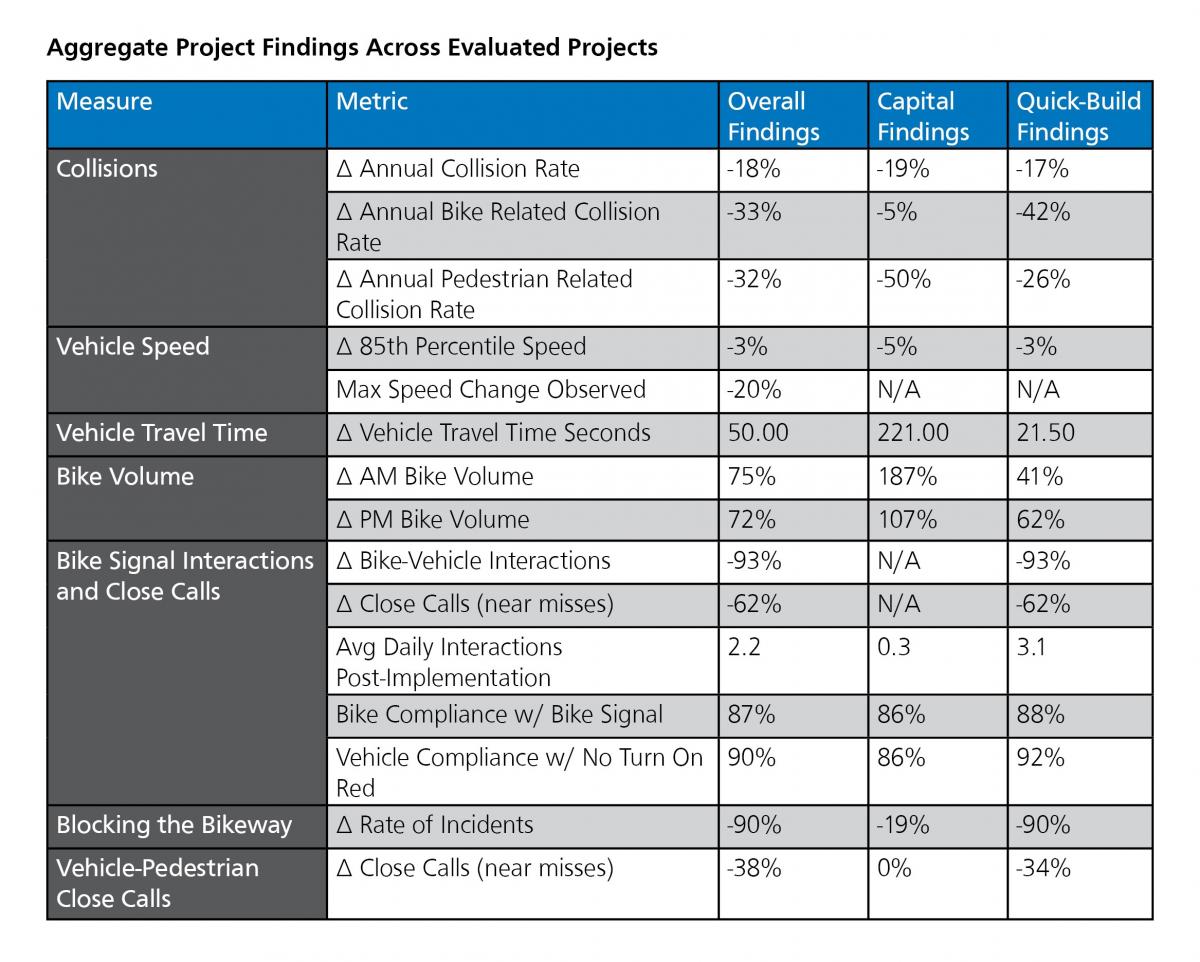
Within the projects evaluated, annual collision rates decreased by 18%
-
Bicycle-related collision rates decreased by 33% and pedestrian-related collision rates decreased by 32%
-
Bicycle volumes on streets that received bicycle improvements increased up to 75% in the morning peak (8 AM to 10 AM) commute times, with similar growth in the afternoon/evening peak (4 PM to 6 PM) commute times.
-
Thanks to protected bikeways, the rate of incidents of vehicles blocking the bike lane decreased by 90%.
-
Close calls or near misses between pedestrians and drivers decreased across evaluated projects by 38%.
-
Several projects in under-served communities such as the Bayview and Tenderloin are helping to address historic inequities and under-investment in these neighborhoods.

The Safe Streets Evaluation team will continue to think creatively about how to build on the evaluation work and use it to inform our current and future projects, programs, and practices through developing a publicly accessible database of all Safe Streets Evaluation data and finding better ways to evaluate project outreach efforts.
View the 2022 Safe Streets Evaluation Summary
Learn more about the SFMTA Safe Streets Evaluation Program: SFMTA.com\safestreetsevaluation
Published November 08, 2022 at 12:56AM
https://ift.tt/H3WTPGg
